Stop Leaking Wealth to Inefficient Tax Strategy
Building a fortified balance sheet for physicians and practice owners through sophisticated financial architecture.
Calculate your Tax Savings
DB/DC Combo Plan Calculator
See how much more you could shelter with a Cash Balance + 401(k) strategy
compared to a standard 401(k) alone.
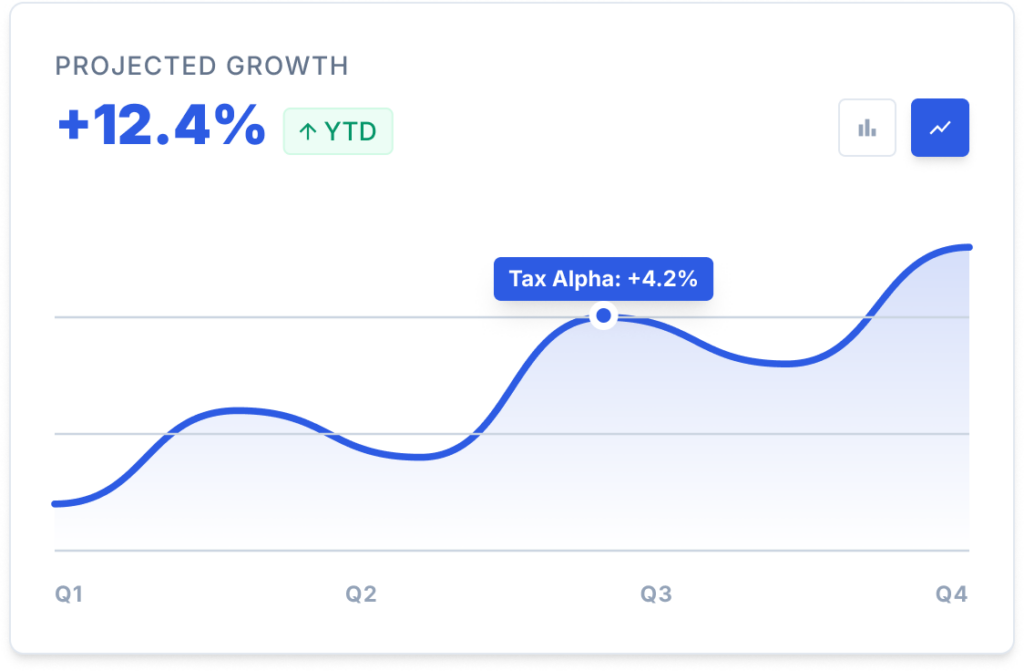
Your Tax Alpha Breakdown
Additional Tax Savings with DB/DC Combo vs. 401(k) Only
Net benefit after all employee costs
Combined Tax Rate
Standard 401(k) Only
Under SECURE 2.0 (effective 2026), individuals with FICA wages exceeding $150,000 in the prior year must make catch-up contributions on a Roth (after-tax) basis. The base $24,500 deferral is unaffected.
For informational purposes only. Consult a qualified tax professional for advice specific to your situation.
FBS DB/DC Combo Plan
Combo Plans (Defined Benefit + 401k)
Employer profit sharing is typically limited to 6% of compensation per IRS Rule 404(a)(7) to maximize tax deductions across both plans. Owners can still reach the $72,000 annual additions limit by combining this 6% with employee deferrals and voluntary after-tax contributions.
Standalone Plans (SEP-IRA or Profit Sharing Only)
Without a Defined Benefit plan, one can contribute up to 25% of eligible compensation, directly up to the $72,000 cap.
For informational purposes only. Consult a qualified tax professional for advice specific to your situation.
The Cash Balance contribution shown is an FBS illustrative estimate based on the owner's age. Actual allowable contributions vary based on plan design, compensation, investment returns, and actuarial assumptions — and must be certified annually by an enrolled actuary as required by ERISA.
FBS Illustrative Estimates by Age
These figures are for illustrative planning purposes only and do not constitute a guarantee of contribution amounts. Consult a qualified actuary and tax professional to determine the exact contributions applicable to your specific plan and situation.
Employee cost is included as employer contributions to employee retirement accounts are a deductible business expense. QBI deduction is shown separately as it is not universally applicable. For informational purposes only. Consult a qualified tax professional for advice specific to your situation.
Additional QBI Deduction Opportunity
Pass-through business owners may qualify to deduct up to 20% of qualified business income under IRC §199A. This is separate from your retirement plan deductions and depends on your entity type, income level, and business activity. Consult your CPA to determine eligibility.
Eligible pass-through business owners — sole proprietors, S-Corps, partnerships, and LLCs — can deduct up to 20% of their qualified business income from taxable income, as extended under current law.
How It's Calculated
Illustrative only — actual QBI is determined per IRS Form 8995 / 8995-A rules.
- Full deduction below $207,200 (single) / $414,400 (MFJ) — adjusted annually for inflation
- Deduction phases out above these thresholds over ~$50,000 range ($100,000 MFJ)
- Specified Service Trades or Businesses (law, medicine, consulting, finance) — deduction is eliminated entirely above the phase-out range, not just reduced
- No cash outflow — you keep the money and still receive the deduction
- Stacks on top of retirement plan deductions (SEP-IRA, Solo 401(k), Cash Balance)
Income thresholds are projected 2026 figures based on IRS inflation adjustment trends and should be confirmed once officially published. For informational purposes only. Consult a qualified tax professional for advice specific to your situation.
This figure is illustrative. Actual QBI savings depend on your taxable income, entity type, and eligibility. Confirm with your CPA.
* Net benefit is calculated after subtracting estimated employee cost.
* Federal rate of 37% is the maximum marginal rate and may not reflect your effective rate. Please contact a CPA for the taxable income percentage applicable to your situation.
Estimates are based on top marginal federal rate (37%) and your state's top marginal income tax rate for CY2026. State tax rates, contribution limits ($24,500 / $32,500 catch-up / $72,000 DC max), and QBI thresholds ($207,200 single / $414,400 MFJ) are IRS-defined figures for 2026 and may change in future years. QBI deduction based on IRC §199A. This tool is for illustrative purposes only and does not constitute financial, tax, or legal advice. Consult a qualified advisor before making plan decisions.
Our 3E Philosophy
Educate
Foundational financial literacy customized for high-income earners to understand the 'why' behind the strategy.
Elevate
Advanced strategies to optimize tax efficiency, utilizing institutional tools unavailable to retail investors.
Engage
Active portfolio management and personalized advisory that evolves with your career trajectory.